





















Static infographic.
The classic: overall visualisation, strategy roadmap or intranet graphic — no questions left open.
The big picture, made visible.
Your topic lives in spreadsheets and slides — and nobody remembers it? An infographic steers the eye to what matters: we turn complex data, facts and processes into graphics that take your audience from "huh?" to "aha!" — and stay in their memory. Custom design in your corporate identity, since 2012.
These brands simplify with us:
Every infographic gets all our passion for visual communication. A look at recent projects — from the education model for Swissmem to Basler Kantonalbank. 4.82 out of 5 · over 280 reviews on ProvenExpert.
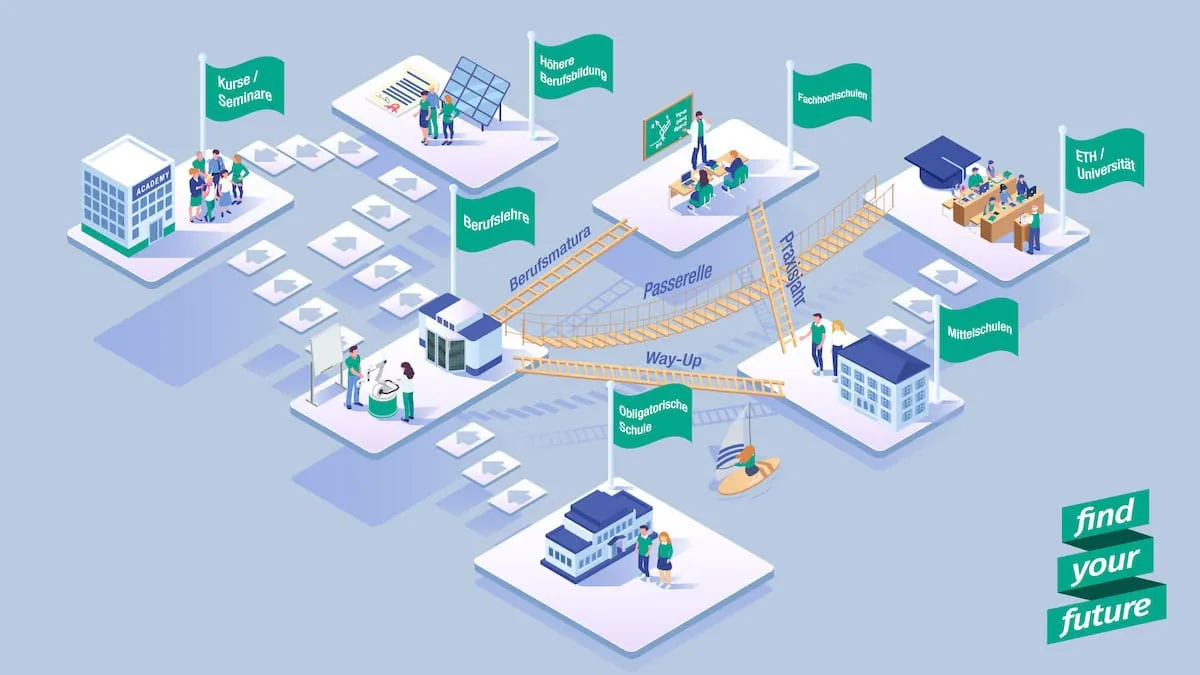
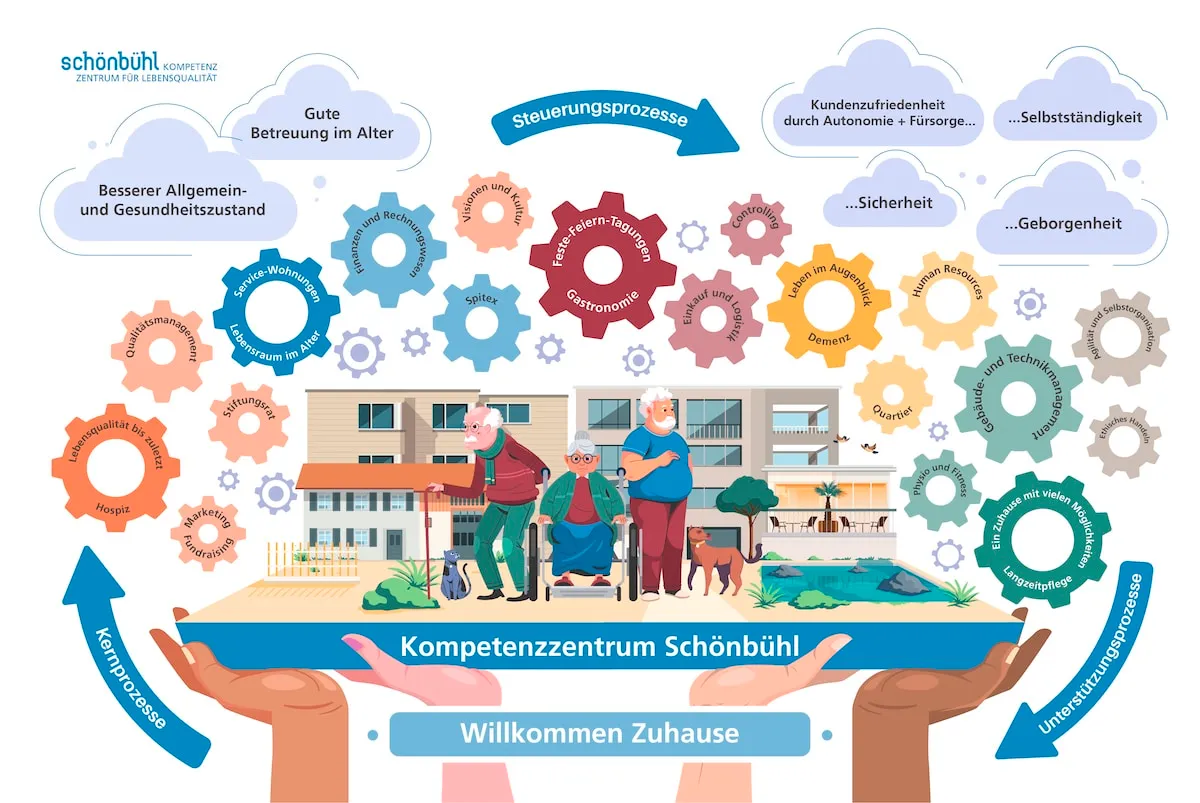
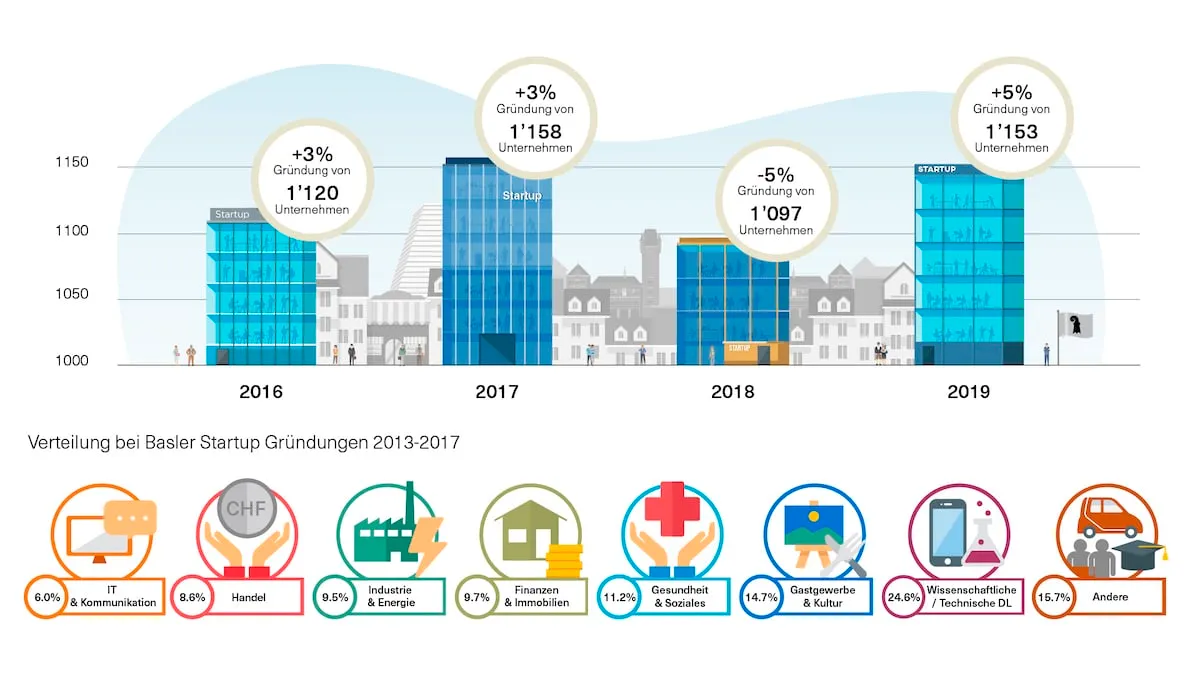
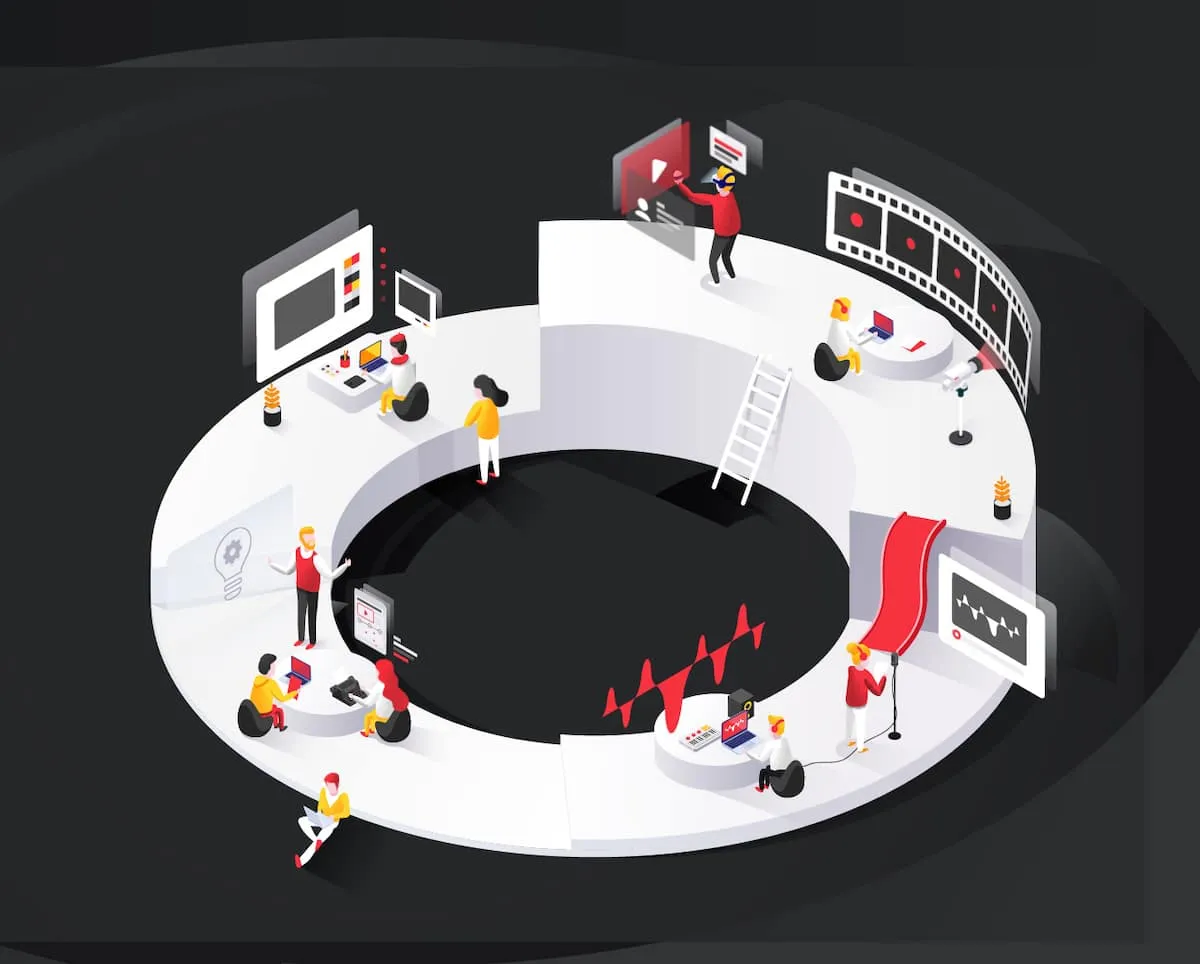
The classic: overall visualisation, strategy roadmap or intranet graphic — no questions left open.
This is where life comes in: for presentations, change mobilisation or your website — graphics and animation make a powerful team.
Those who participate learn best: perfect for blended learning — with embedded explainer videos, sales tools and more.
You bring the topic, we take over every step — from idea to distribution. In the kick-off we dig into your topic and define message and audience. In the concept we develop the idea and an individual design style to match your CI/CD. In design, ideas become graphics you can embed seamlessly in web, print or brochures. At distribution it pays off that a good infographic works cross-media — website, presentations, social media. As a 360° agency we make sure it gets seen.


An infographic presents data and facts visually — as a graphic that is easy to understand. It consists of text, images, diagrams and sometimes video elements, and makes complex facts or processes tangible and memorable: a signpost in the information jungle. The principle: one central message, strong design, a clear idea of the audience — images, colours, icons and numbers lead the eye from start to finish, like a well-told story.
Infographics fit wherever a lot of information has little space: annual report, intranet, strategy roadmap, presentation, social media, poster at the point of sale. Videodesign has visualised complex information for over ten years — for brands like Roche, Siemens, SBB and Swissmem — and designs every infographic individually to your corporate identity: static, animated or interactive. The goal stays the same: your audience understands at a glance what would otherwise take pages.
An infographic at Videodesign starts from CHF 3'500. Beyond that, style, scope and format count — a static graphic for the intranet is a different project from an animated infographic for your campaign or an interactive learning track. The main factors: the amount of content, the illustration depth (simple icons or a detail-rich overall visualisation), the share of animation and any language versions. The exact price comes in a non-binding offer: after the free consultation you receive a PDF quote within 24 hours listing every item — the amount in the quote is the amount on the invoice, no small print.
Reply within 12 hours. A saving tip: if your infographic complements an existing video — say, as a summary of your explainer video — we reuse existing illustrations, and you benefit twice. Tell us in the first conversation what already exists.
Three proven ones — and they can be combined. The static infographic is the classic: one image that says it all, from a detail-rich overall visualisation to a strategy roadmap to an overview for the intranet or annual report — digital or in print, no questions left open. The animated infographic adds motion: graphics and animation make a powerful team — ideal for presentations, change mobilisation or your website, where movement wins attention and processes become visible step by step. The interactive infographic lets your audience take part: users click through layers and details, with explainer videos, sales tools and more embedded — perfect for blended learning and wherever depth on demand is needed.
Because those who take part learn best. Which format fits is decided by where it lives and who it is for: print and PDF favour static, stage and web favour animated, learning and sales contexts favour interactive. We advise you honestly — and build what carries your message most clearly.
A good infographic joins appealing design and well-conveyed facts into a narrative that sticks. It takes four things. One central message: it must be clear what the one insight is — a graphic meant to carry five messages carries none. Strong design: images, colours, icons and numbers steer the reading flow from start to finish — the eye is guided, not left to itself.
The audience: a graphic for experts may be denser than one for the general public; who reads it determines how much it may show. And simplicity: an infographic should make understanding easier — a light, uncluttered design is the be-all and end-all. The simplest test is the same as with our videos: show the graphic to someone who doesn't know the topic. If they get the core message in seconds, it works — and your message is heard and remembered.
Four steps — we take over all the work, from idea to distribution. Kick-off: we dig into your topic, define message and audience and clear up open questions — this is where we decide what the graphic must show and what it may leave out. Concept: we develop the idea and an individual design style to match your CI/CD — no template, your look. Design: ideas become graphics; you give feedback, we refine — until an infographic stands that you can embed seamlessly in web, print or brochures.
Distribution: a good infographic works cross-media — website, presentations, social media; as a 360° agency we make sure it gets seen. For animated and interactive formats an implementation phase with animation or interaction logic is added. At the end you receive every format your rollout needs — print-ready, web-optimised or embedded.
It depends on the scope and the share of animation: a focused static graphic is finished much faster than a detail-rich overall visualisation or an interactive track with embedded videos. So we don't give you a blanket figure but a binding date: in the kick-off we set the schedule, aligned with your occasion — annual report, campaign launch, presentation date or trade fair. After that you know exactly when you'll see drafts and when we need your feedback.
Content speeds things up most: the earlier data, facts and text modules are available — and the clearer it is internally who signs off — the faster the graphic stands. If it has to move really fast, talk to us: we find a solution, say a focused first version or a staggered delivery. Before the start, as always: reply within 12 hours, free PDF quote with schedule within 24 hours.
Both translate complexity into imagery — the difference is time and depth. The infographic works at a glance: it shows structures, numbers and connections at once, and your audience decides where to look and for how long. Strong for overviews, roadmaps, reports and anything printed or hanging as a still image on the intranet. The explainer video leads through a story: in about 90 seconds the dramaturgy decides what is understood when — with voice, animation and sound.
Strong for processes with a sequence, emotional messages and channels where moving images win. Often the combination is the best answer: the video as the entry point, the infographic as the reminder afterwards — from the same illustration set, so both look like your brand and reinforce each other. An infographic for your video can also be added later. What your topic needs is something we settle in the free consultation — and if it's the video, we'll say so just as honestly.
Have an Infographic Created
Tell us what your audience doesn't yet understand — and what it should. Together we build bridges of understanding across gaps of understanding. Infographics start from CHF 3'500. Free consultation, reply within 12 hours, PDF quote within 24 hours.
Your PDF quote arrives within 24 hours – free and without obligation.